Agentic AI x Supply Chain
Overview
To support C3 AI’s annual customer conference and strategic product roadmap, I led the design of a cross-product demo envisioning how agentic AI could reshape human-AI collaboration across four key supply chain products. These demos showcased how intelligent agents could proactively initiate action, explain AI outputs, and guide users through complex decision-making processes—demonstrating C3’s leadership in enterprise-grade agentic AI.
Supply Chain Agentic AI Design Prototype Demo at C3 Conference
My Role & Contribution
Led end-to-end design concepting, UX flow development, and narrative framing for all four agentic AI demos.
Collaborated with PMs to align AI capabilities with user-centered workflows.
Shaped how C3 AI communicated its vision for agent-initiated, collaborative AI in operational settings.
Impact
The demos received highly positive reception from enterprise clients at the conference, sparking new conversations around agentic workflows and future implementations.
Solidified C3 AI’s positioning as a thought leader in operationalizing agentic AI in real enterprise software.
Internally, this work influenced strategic product planning and seeded ideas for roadmap-level initiatives across multiple verticals.Impact
Design Detail
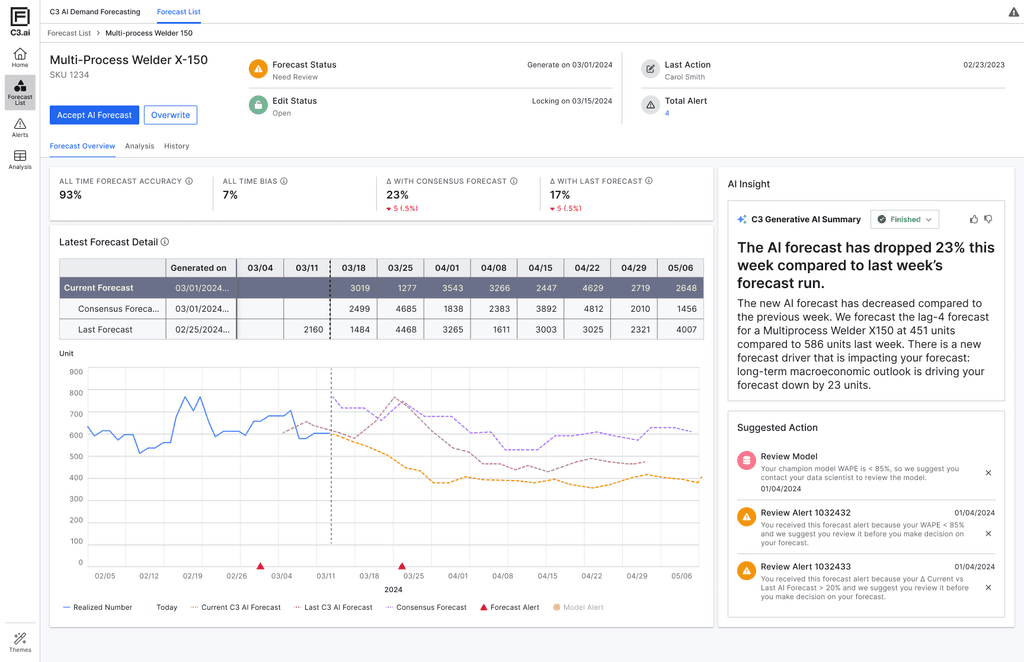
AI Forecast Overview with Natural Language Insight
Natural Language Summary (NLG)
Automatically generates plain-language explanations of key forecast changes. This builds user trust by turning opaque model shifts into understandable business context.
Progressive Disclosure
Information is layered by importance—high-level alerts and suggested actions are shown upfront, while deeper data (forecast tables, trends, version comparisons) remains available but non-intrusive. This reduces cognitive overload and lets planners focus on what matters first.
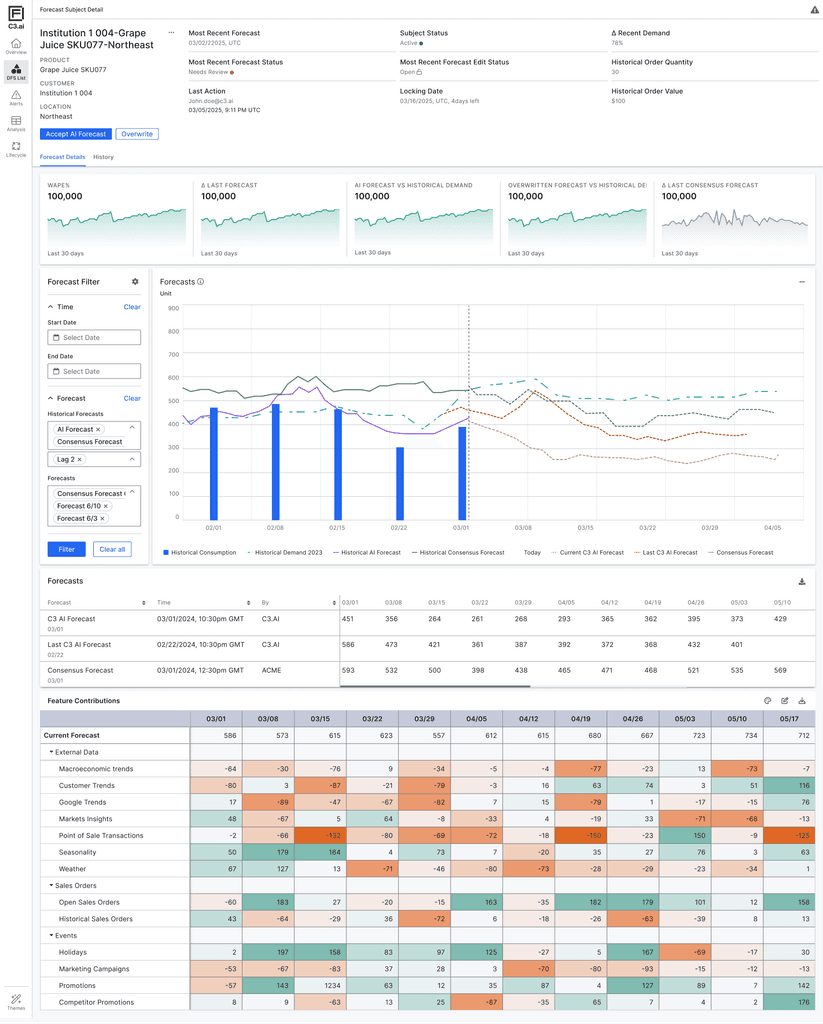
Forecast Visualization & Feature Contribution
Shows AI forecast alongside historical demand, historical forecasts, and consensus forecasts—enabling users to visually validate the AI output, compare trends over time, and detect anomalies or shifts. This supports planners’ natural tendency to “sense-check” data before taking action.
Breaks down how individual input factors (e.g., weather, promotions, market signals) are driving the forecast up or down, across time. The color intensity helps users quickly identify dominant influences on the forecast, improving interpretability and model accountability.
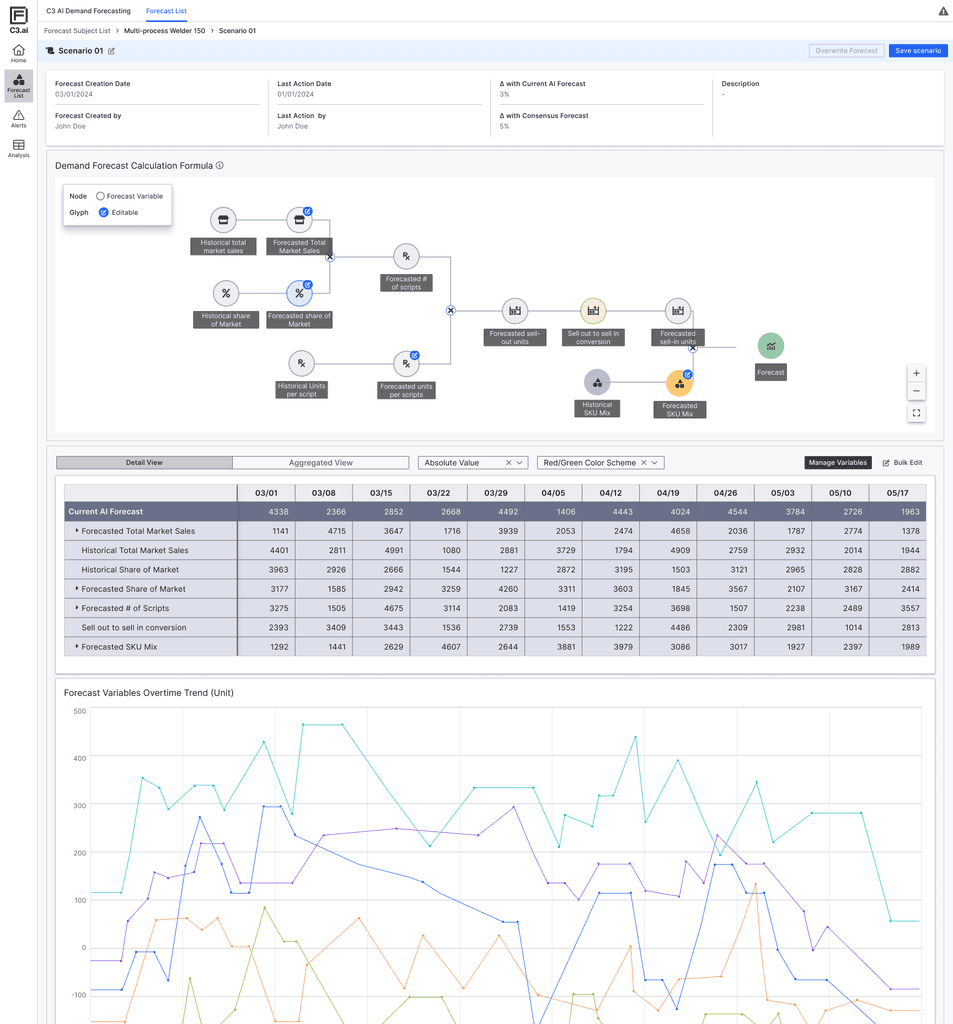
What-if Forecasting & AI Equation Visualization
Scenario Simulation Panel
Enables users to create alternative forecast scenarios by editing key input variables. This supports a common behavior among planners: comparing multiple versions of a forecast to validate assumptions and evaluate potential outcomes.
Forecast Equation Node Graph
Visually illustrates how the AI model calculates its output using market share, sell-out rate, mix, and scripts. This helps users better grasp the internal logic of the model and builds transparency around how different variables interact.