
Best Practices
Choose Compelling Topics
Use analytics tools to understand demographic data and user behavior. Tailor your content to address audience needs and interests, solving their specific problems. Conduct keyword research with tools like Google Keyword Planner or SEMrush. Analyze industry trends and competitors to select relevant and trending topics that improve SEO. Utilize headline analyzers like CoSchedule's Headline Analyzer. Craft titles that are clear, specific, and contain high-ranking keywords. Use power words to increase click-through rates.
Organize Your Content
Implement a clear structure using HTML tags for headings (H1, H2, H3) and lists (<ul>, <ol>). This enhances readability and SEO. Leverage CSS for formatting to improve UX. Embed high-quality images, infographics, charts, and graphs. Use Framer for creating visuals and optimize them with alt text for SEO. Ensure they are mobile-responsive. Place keywords naturally within the content, especially in headings and subheadings. Optimize meta descriptions, image alt texts, and use internal and external links.
Pagination and SEO
Consider adding pagination for extensive content lists, enhancing performance by reducing load times and improving user experience by making large amounts of content more readable and navigable. Additionally, pagination benefits SEO by facilitating easier search engine crawling and reducing bounce rates. By selecting a list of content coming from the blog, you can click the blue plus icon at the bottom to add infinite scrolling or a load more button. If you add pagination with infinite scrolling, try to avoid positioning layouts like pivots and footers below the loading content. This will help minimize layout shifts, thus not harming SEO.
Monitor Performance
Utilize the built-in Framer analytics to track performance metrics and adjust content strategy based on data insights. By combining these best practices with technical best techniques, you can create a blog that not only engages and informs but also performs well in search rankings and user engagement. Happy blogging!
Design Detail
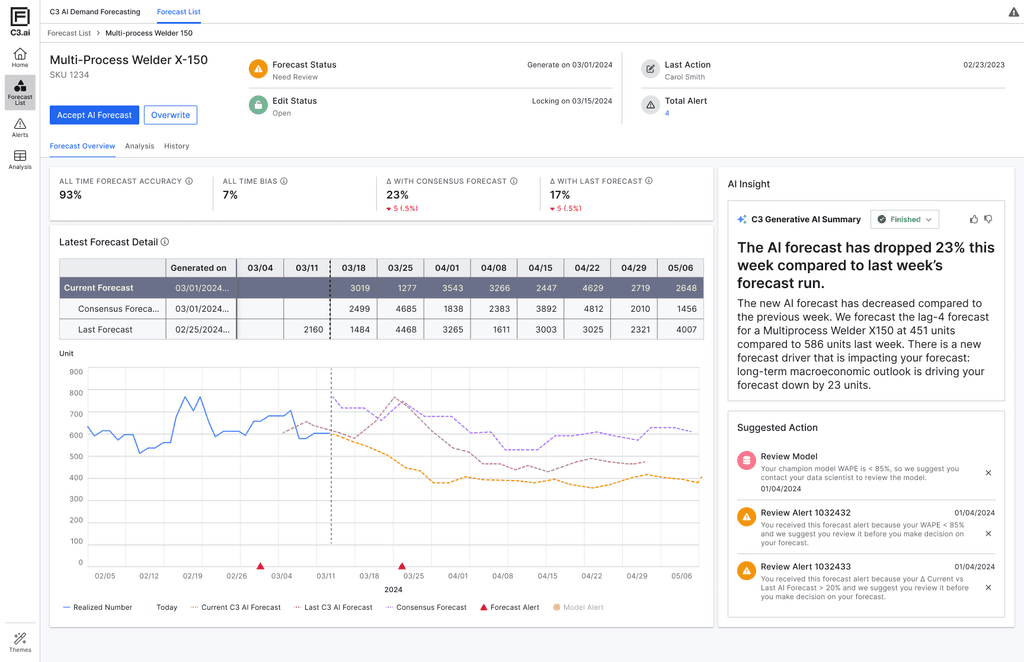
AI Forecast Overview with Natural Language Insight
Natural Language Summary (NLG)
Automatically generates plain-language explanations of key forecast changes. This builds user trust by turning opaque model shifts into understandable business context.
Progressive Disclosure
Information is layered by importance—high-level alerts and suggested actions are shown upfront, while deeper data (forecast tables, trends, version comparisons) remains available but non-intrusive. This reduces cognitive overload and lets planners focus on what matters first.
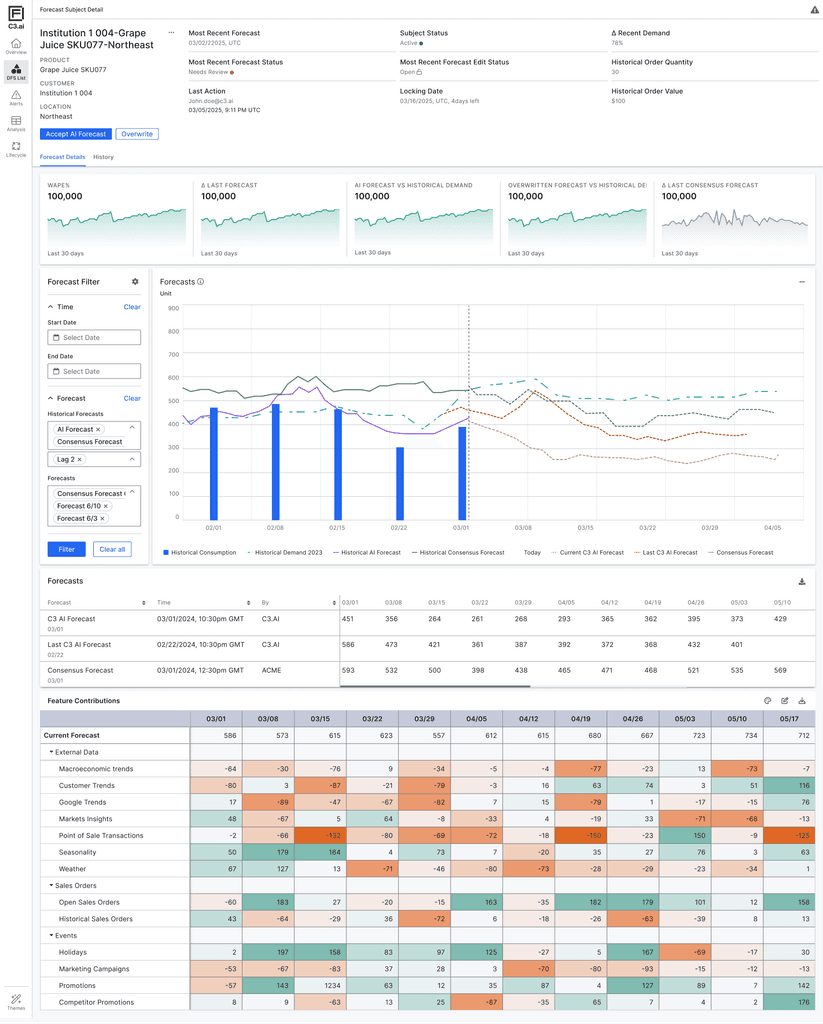
Forecast Visualization & Feature Contribution
Shows AI forecast alongside historical demand, historical forecasts, and consensus forecasts—enabling users to visually validate the AI output, compare trends over time, and detect anomalies or shifts. This supports planners’ natural tendency to “sense-check” data before taking action.
Breaks down how individual input factors (e.g., weather, promotions, market signals) are driving the forecast up or down, across time. The color intensity helps users quickly identify dominant influences on the forecast, improving interpretability and model accountability.
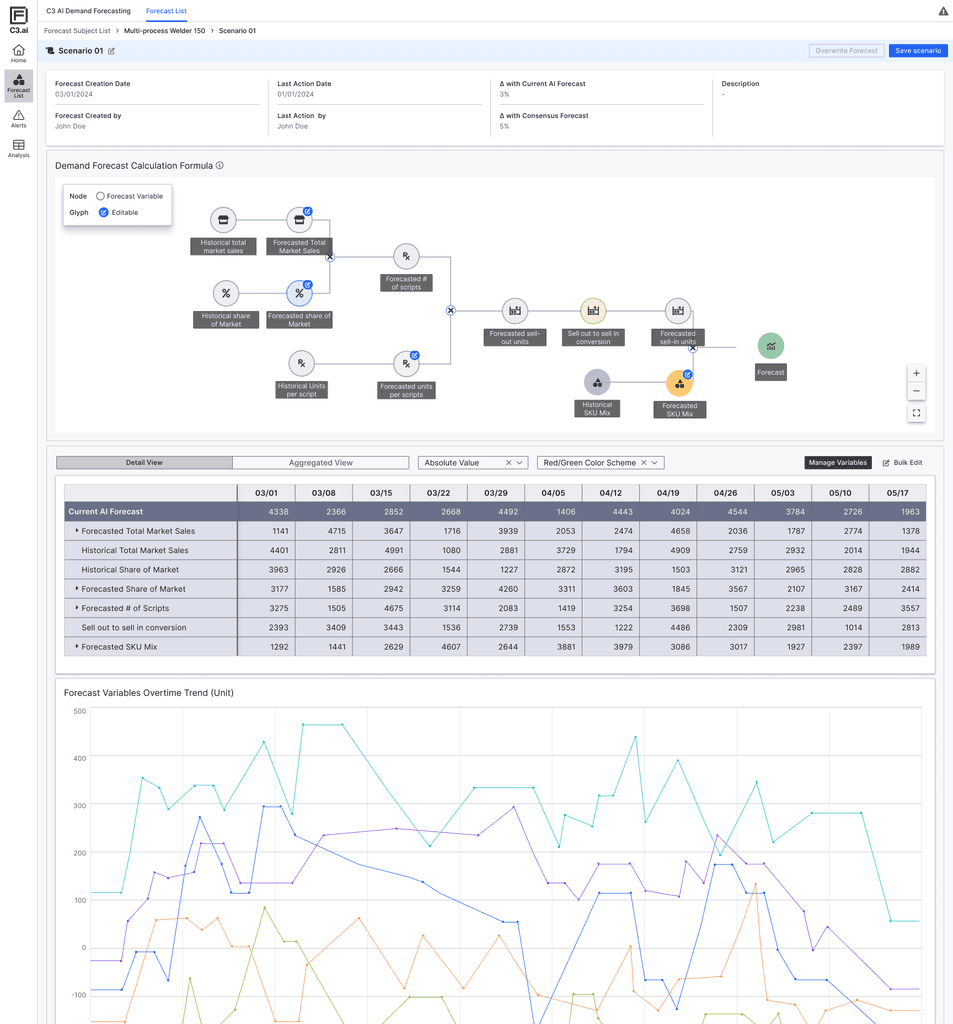
What-if Forecasting & AI Equation Visualization
Scenario Simulation Panel
Enables users to create alternative forecast scenarios by editing key input variables. This supports a common behavior among planners: comparing multiple versions of a forecast to validate assumptions and evaluate potential outcomes.
Forecast Equation Node Graph
Visually illustrates how the AI model calculates its output using market share, sell-out rate, mix, and scripts. This helps users better grasp the internal logic of the model and builds transparency around how different variables interact.