
Importing Content
Prepare your CSV file
Make sure your file is exported as a "CSV" file, also known as a "Comma Separated Values" file. If you encounter any issues you'll want to verify your file is UTF-8 encoded and less than 5mb. If your file is larger than that, try removing columns you may not need. See below for additional information on specific fields.
Tip: You do not have to import every column from your CSV. Only fields set up in your CMS collection in the next step will be imported.
Rich Text Fields
Formatted text content needs to be formatted as HTML. Many tags are supported, such as paragraphs and headers <p>,<h1>, <h2>), formatting (<em>, <i>, <strong>), links (<a>), lists (<ol>, <ul>, <li>) and images (<img>). Images from URLs will be automatically downloaded from their original source and imported into Framer.
Image Fields
Images in your CSV content must be URLs to an image. They will be downloaded and imported into Framer. Relative paths are not supported.
Date Fields
Recommended format is ISO8601 compliant, for example: 2023-12-17T14:42:00. The shorthand value of year-month-day is also supported, for example: 1982-12-01. Long format strings may work, but will depend on your browser, for example: Tue May 12 2020 18:50:21 GMT-0500 (Central Daylight Time). All time data, including time zone information, will be stripped from the date.
Color Fields
A color formatted as CSS hexadecimal RGB code, rgb, hls or hlv expression, or a named color. All variants with an alpha value are also supported. Examples: #00ffee, rgb(0, 153, 255), hsla(204, 100%, 50%, 0.5), blue, darkgreen, rebeccapurple.
Toggle Fields
A boolean value. Y, yes, TRUE, 1 will be interpreted as the toggle being "Yes", all other values will be "No".
Prepare your CMS Collection
Here is a checklist to prepare your CMS collection for importing.
Verify each field/column in your CSV has a matching field in your CMS collection with the same name.
Include a unique field for each item, often named "Slug"
Verify that your data types match (eg. a CMS Date field for a date field in your data)
Tip: Framer uses your Slug field to identify each item, and will use it to update that item with repeat imports.
Import your CSV file
You can find the Import feature by going to the CMS in your project, and clicking "Import" in the toolbar. From there, you can select your CSV file for importing. You may also drag & drop your CSV file directly into the CMS collection interface.
Tip: Importing supports Undo / Redo actions. If you're not happy with the import, you can simply undo the change with CMD+Z on MacOS or CTRL + Z on Windows. Redo will not re-run the import, but instantly apply the changes to the collection.
Updating or Re-Importing
To update your content, you can import into the same collection again. If any item in the new import has a slug field that matches one of the items in your collection, you will be able to update it or skip importing it again.
Design Detail
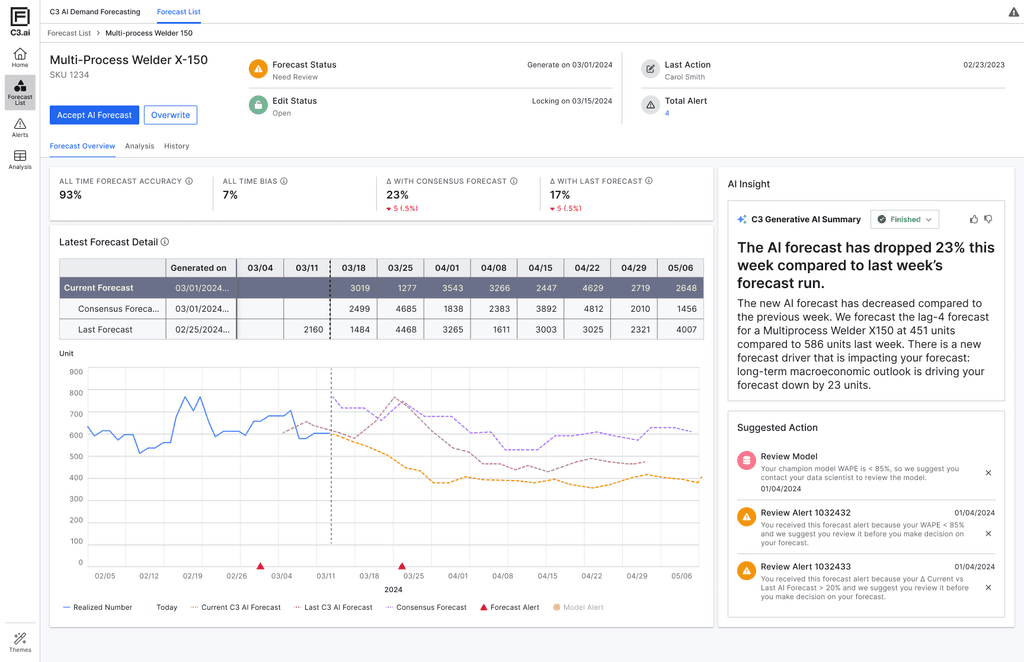
AI Forecast Overview with Natural Language Insight
Natural Language Summary (NLG)
Automatically generates plain-language explanations of key forecast changes. This builds user trust by turning opaque model shifts into understandable business context.
Progressive Disclosure
Information is layered by importance—high-level alerts and suggested actions are shown upfront, while deeper data (forecast tables, trends, version comparisons) remains available but non-intrusive. This reduces cognitive overload and lets planners focus on what matters first.
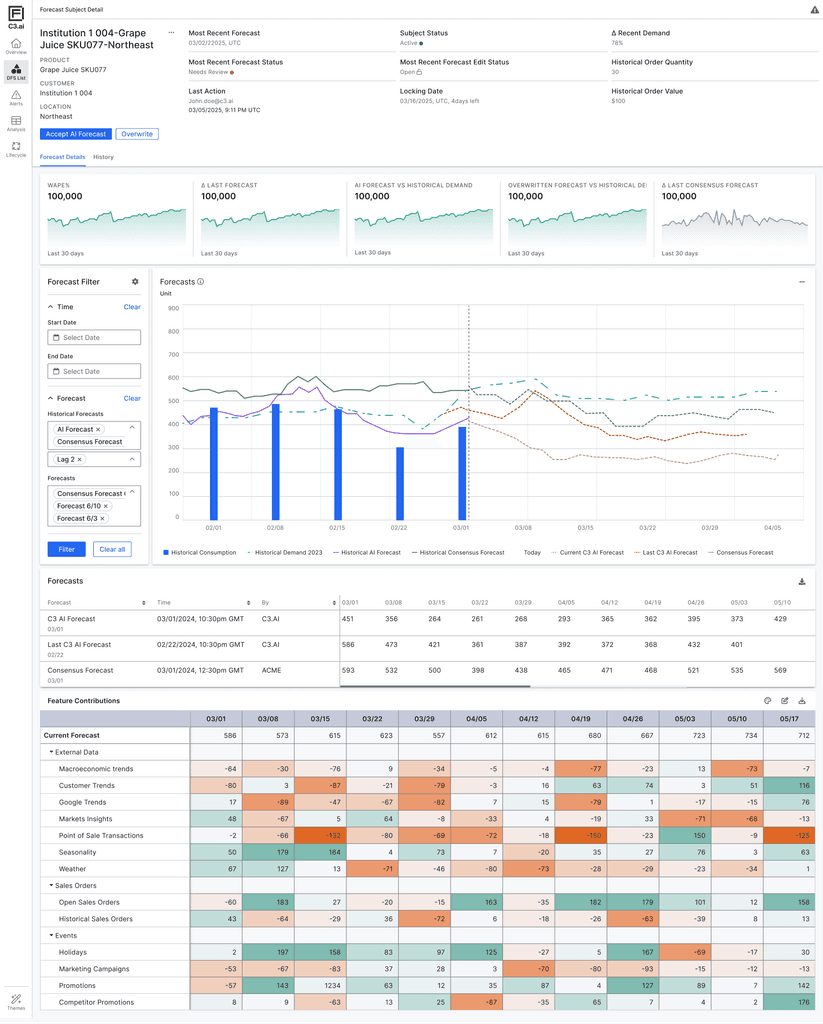
Forecast Visualization & Feature Contribution
Shows AI forecast alongside historical demand, historical forecasts, and consensus forecasts—enabling users to visually validate the AI output, compare trends over time, and detect anomalies or shifts. This supports planners’ natural tendency to “sense-check” data before taking action.
Breaks down how individual input factors (e.g., weather, promotions, market signals) are driving the forecast up or down, across time. The color intensity helps users quickly identify dominant influences on the forecast, improving interpretability and model accountability.
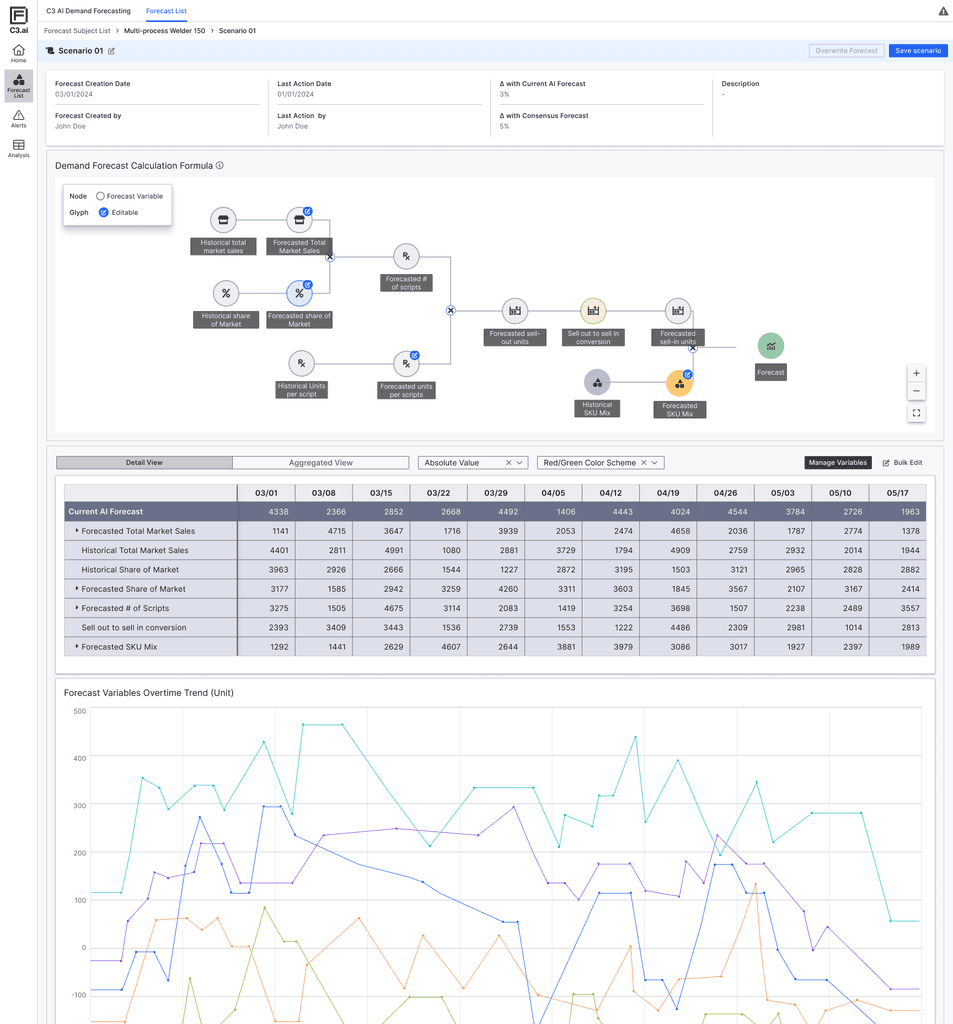
What-if Forecasting & AI Equation Visualization
Scenario Simulation Panel
Enables users to create alternative forecast scenarios by editing key input variables. This supports a common behavior among planners: comparing multiple versions of a forecast to validate assumptions and evaluate potential outcomes.
Forecast Equation Node Graph
Visually illustrates how the AI model calculates its output using market share, sell-out rate, mix, and scripts. This helps users better grasp the internal logic of the model and builds transparency around how different variables interact.